Living with water: Understanding flood risk in an era of climate variability
June 11, 2020
June 11, 2020
Helping property owners and stakeholders understand their risks and providing tools that support action
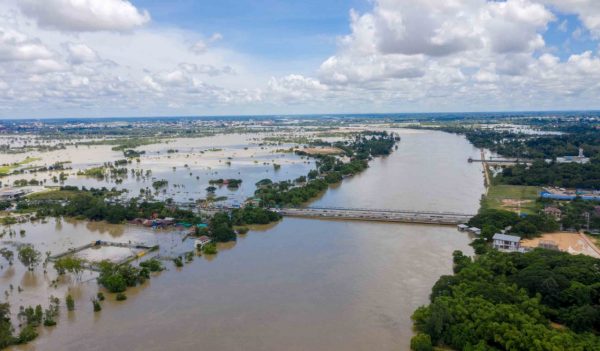
In the last several years, the US has experienced multiple hurricanes, several major storms, and countless severe weather events that have claimed lives, flooded communities, and levelled homes and businesses. As disaster recovery and mitigation efforts evolved, many property owners were left with a choice: to rebuild or abandon.
This decision was influenced by many factors—does the property owner have flood insurance, are there federal grants and loans available, how vulnerable is the property to another significant weather event, and how should impacts like climate variability be factored.
Ultimately, this decision was informed by understanding future risks and tools available to mitigate such challenges. Over the last four decades working on various parts of the Federal Emergency Management Agency (FEMA) program, we have provided high quality data, increased awareness, and facilitated local mitigation actions to reduce risk. A fundamental challenge that persists, however, isn’t the quality of the data, but property owners’ and stakeholders’ understanding and access to credible, actionable information.
To better protect communities, we must improve the understanding of flood risk among all stakeholders.
There is no question the improvements in computing, modeling software, and the availability of high-resolution digital terrain data have significantly advanced flood hazard and flood risk data development. Also, public engagement processes and access to information has improved dramatically.
The challenge for FEMA is the same today as it has been for decades: How can we communicate risk in a way where people understand the threat and are compelled to act?
As engineers and technical professionals, we produce the data and products used to communicate risk. The recipients of that information may be professionals who understand the science and technical information behind the mapping, but most of the audience does not. The largest audience, by far, just wants to know, “What’s my risk? How credible is this information? And, what should I do with this knowledge now?”
Access to actionable insights can drastically improve how certain professionals and organizations serve their communities.
Take, for example, the homeowner experience in buying flood insurance. Property owners can find map-based, flood-risk information that draws from publicly available FEMA data. The individual may walk away with a rating of high, medium, or low risk. But do they truly understand the risk? And how relevant is this information to the individual? Consider also that property owners are typically asked some very basic questions—“What’s your age?” and “What’s the property address?”—while few questions focus on the characteristics of the property.
Does the owner really understand their flood risk and what is covered? As professionals, we put time and talent into creating credible flood-risk data used to create mapping products and support decisions. But when it comes time to decide on insurance, the information that the insurance company uses to calculate rates is invisible to the consumers.
There’s a better way.
Currently, our products and information are packaged in a suitcase with many compartments—the Digital Flood Insurance Rate Map (DFIRM) database. It is incredibly powerful but does not yet provide the full extent of flood risk across the nation and needs to be integrated with other data to create truly consumable, actionable information. We can fix that.
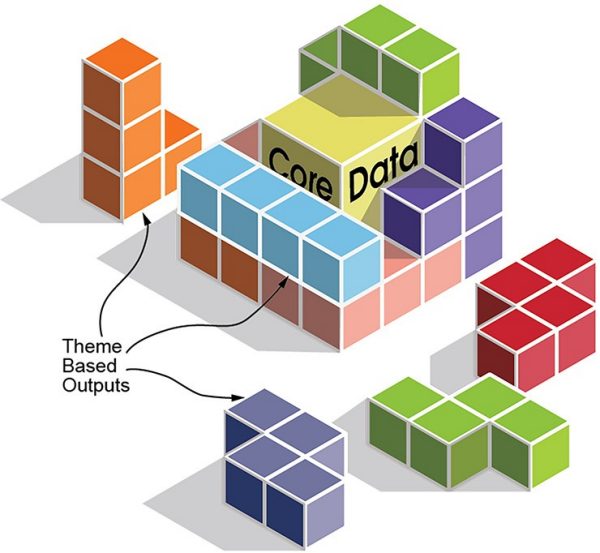
Visualizing flood data by user case allows us to solve for specific themes to generate actionable information.
A simplified way to approach the issues is to visualize a puzzle cube. Within that cube are all the valuable flood risk and supporting data that exists today. This includes core data from FEMA’s DFIRM database, flood depth data, national scale pluvial flood risk data, building structure data, historical flood data, building codes and standards, and the list goes on. Much like when you solve the puzzle cube by putting the pieces together in the right place, the flood puzzle cube is solved by putting the data together with the right theme, such as insurance or mitigation, among others. Simply put, you align the data elements in the cube for a theme or solvable patterns. Once the pieces of data are organized to an appropriate theme, end users can then access actionable information from various tools, such as online dashboards, mobile apps, or virtual voice assistants.
In other words, when someone asks their phone “Show me my flood elevation,” the result would be at their fingertips. They could also say, “Show me how high I should build at this location,” and it would have the same result.
Once you get past the challenge of getting people to understand their risk, you are left with the challenge of getting people to take action to protect their property. The other imperative is to address the financial risk by purchasing insurance, so if something does occur, they have a way of paying for the repairs.
Many people don’t believe they can afford to protect their property. But we believe with the right information, people would see an obvious cost benefit to being prepared. At the same time, they could access low-interest loans, grants, and other programs that would help them take steps to reduce the impacts of flooding on their property.
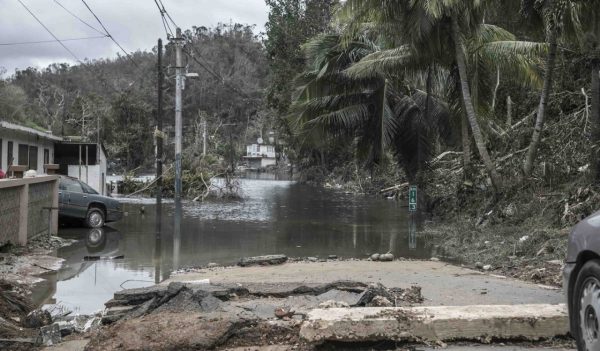
Flooding in Puerto Rico following a hurricane. Improving property owners’ understanding of flood risk can increase the likelihood that they will take action to protect themselves.
Of course, property owners aren’t the only ones who need flood information. Access to actionable insights can drastically improve how certain professionals and organizations serve their communities. You can integrate the core data and develop data outputs for a theme relevant to the needs of various stakeholders. Here are a few examples:
In short, we can organize flood data into solvable patterns that allows us to ask direct questions of our data and receive actionable answers. This information empowers people at all levels, from property owners to the federal government, to take the necessary precautions.
At the end of the day, the bottom line is doing everything we can to keep our communities protected.