New housing numbers and new population projections: all crystal clear now?
May 31, 2018
May 31, 2018
The Government’s new method for assessing housing need is expected to come into force by the end of July
The promise is that planning for housing will be much easier, as a complicated process is replaced by a standard formula. But the reality is not quite so simple.
Many authorities will be driven by economic and social ambition to identify need above the Government’s standard figures. For other authorities, the numbers will need to be adjusted for errors in the official demographic projections. Across England, local authorities and service providers will want to know the numbers and age profile of the future population that will result from the new housing numbers. All this will need new demographic and economic scenarios, beyond the numbers that the Government provides.
What is more, new official population projections suggest that housing need across England may be 244,000 new homes a year, rather than the 266,000 set by the Government last September. Further changes to the projections are in the pipeline, with results that are hard to predict. In response to new projections the Government may change the standard formula, so it sticks to the target of 266,000—or it may not. Further to all those changes, in just a few months’ time there may be new standard housing need figures, quite different from those published last September.
In short, the Government’s new approach raises new questions and creates new uncertainties. To navigate the new system successfully, plan-makers, developers and infrastructure providers will need new evidence. Our data tool provides that evidence, through state-of-the art forecasting that models potential local futures, integrating housing, population and jobs.
The Chief Planner for England has confirmed that the Government’s latest package of planning reforms will be issued by the end of July. One item that will make headlines is the new standard method to measure housing need.
Under the present planning guidance, the method for calculating this all-important number is complex and desperately unclear, more like sorcery than science. This has massively slowed down the planning process, and no doubt produced some bad plans and appeal decisions. Under the new system things will be very different. Minimum housing need by local authority area will be produced by the Government, using a transparent formula based on just three factors:
The Government in September 2017 published indicative housing need figures by local authority, based on applying this formula to the 2014-based household projections.
The new formula is a huge simplification. Many will welcome it, almost regardless of the actual numbers. But does it mean that plan-makers and developers should just accept the standard numbers and shift their attention to more inspiring topics?
Not quite. The process won’t be nearly as painful as before. But still, many areas will need more evidence about the housing and population they should plan for. Here are some critical questions that the standard numbers do not answer.
The Government is encouraging authorities to identify housing need above the Government’s standard number. Uplifts may be driven by economic and social ambition, or respond to special opportunities such as new infrastructure. In places where homes are relatively cheap, the standard formula produces low housing need. The standard number may imply considerably less housebuilding than earlier targets, resulting in a stagnant and ageing population and a shrinking workforce. Councils and the private sector alike will want to aim for a more dynamic future.
But alternative numbers of homes, people and jobs cannot be plucked out of thin air. In line with national policy (both current and proposed), Local Plans must be deliverable and realistic; sites must not be allocated for uses that do not have a reasonable prospect of being delivered; and the planning of jobs, homes and services must be integrated. Plans that do not meet these criteria will be open to challenge. For sound plans, ambitious strategies need to be underpinned by robust policy-led forecasts that combine good demography with good economics.
The new draft Guidance allows departures from the standard method where exceptional circumstances apply. It does not define such circumstances, but they are certain to include technical problems with the ONS projections. Across the country those projections are the best available, and they work well for most places most of the time. But sometimes they are distorted by errors such as Unattributable Population Change (UPC), and such distortions may be very large. For Cambridge City, for example, under the present system correcting for UPC lifts the demographically projected housing need by 48%. For Tendering, the error is in the opposite direction, so correcting it reduces the projected need by 29%.
Where such major distortions occur, they should be diagnosed and corrected. If they are not, authorities will rely on figures that show many more or many fewer new homes than the area needs and the market can deliver. If the need figures are too high, so in practice they cannot be delivered, authorities will be penalised under the Government’s new Delivery Test. If the figures are too low, true housing need will not be met and economic growth may be held back.
Local authorities, developers and infrastructure providers alike need to know the size and age profile of the population that will result from meeting the assessed housing need. For many areas, this population will be very different from that shown in the official demographic projections, because the affordability uplift will have a large impact both on total numbers and the mix of age groups. (For 51 of the 326 authorities in England, the Government’s indicative standard housing number is more than 50% above the projections.) The Government could have commissioned ONS to produce special projections to estimate this population, but it has chosen not to.
Councils need to know the future population so they can plan for education, retail and infrastructure, and assess the housing needs of particular groups, as required by the Framework both existing and revised. The same information is needed by the utilities providers, transport operators, retailers and providers of specialist housing for students or the elderly. To invest in the right places, they need to know how many potential customers they will have in different places in future.
Under the new system, the ONS projections will no longer be a reliable guide to future population—because they reflect past trends rather than the new homes likely to be built in future, and the Government intends the future to be very different from the past. We need population projections that reflect the Government’s standard numbers, and any local departures from those numbers.
A further complication is that those standard numbers may be about to change substantially, further to the 2016-based sub-national population projections published by ONS on 24 May. New 2016-based household projections derived from this population will follow in September. Those household projections will replace the 2014-based version that underpins the indicative housing need numbers published last year. They could have dramatic implications for planning—depending how the Government responds.
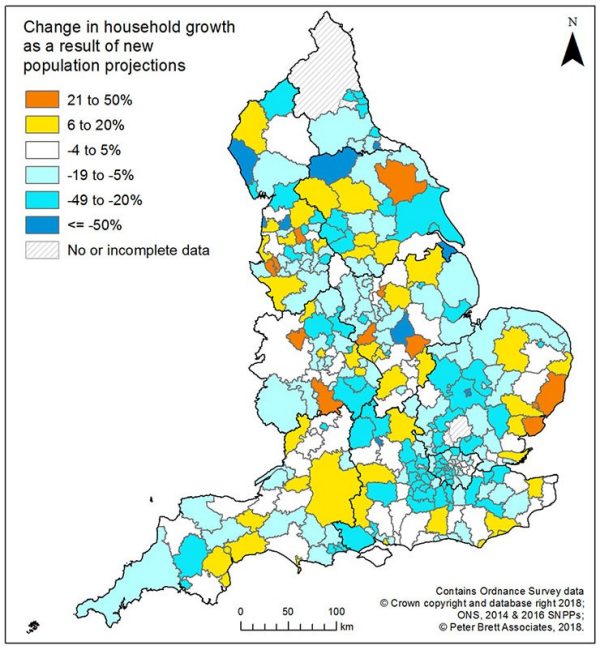
For England as a whole, over the planning period 2016–26 the 2016-based projections show 17% less population growth than the 2014-based ones. At local level, for 44% of local authorities population growth is reduced by more than 20%. The reason is that ONS now expects less international migration to the UK, as well as higher death rates and lower birth rates.
We have estimated the housing need that would result from the new population projections, together with the 2017 housing affordability data published by ONS in April. Our figures assume that the Government’s standard formula is unchanged, and also that household formation rates—the factor that groups population into households—remain the same as in the 2014-based projections. They also cap the figures in line with the latest adopted plans.
The result is housing need well below the Government’s indicative numbers. For England in 2016–26, the new projections suggest annual housing need of 244,000, compared to 266,000 in the indicative numbers. If the standard formula stays the same, housing need will be more than 20% below the Government’s indicative figures.
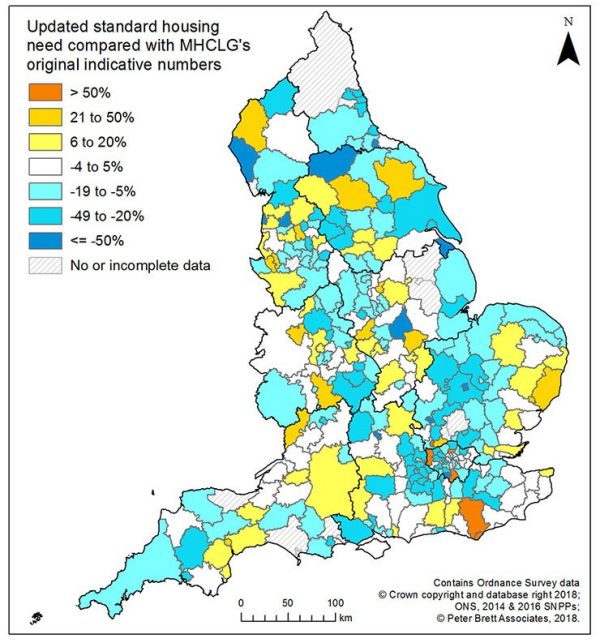
The maps below show our updated estimates of housing need by local authority area, derived from the 2016-based population projection. The first map compares it with the indicative figures published last year. The second map compares the updated housing need with current policy requirements in adopted Local Plans.
The factors that underpin our estimates are liable to change, and in unpredictable ways. Part of the problem is that the ONS’s projection methods are in transition. The new household projections to be published in September may use a new approach to household formation rates. Before then, on 28th June the ONS is due to publish new population estimates for mid-2017, which will incorporate a revised view of past domestic migration. For some areas those new figures may render the 2016-based household projections out of date, even before they are published.
Another hard-to-predict factor is the Government response to the new projections. In the light of the 2016-based projections, the standard formula might be amended to bring the England total back to the Government target of 266,000 new homes per year for England. The Government might even raise the figure to 300,000 new homes, in line with recent ministerial statements.
All these potential changes, both in ONS projections and Government policy, may have a large impact on housing need figures. In just a few months’ time, many authorities are likely to find that their standard figures are very different to the indicative numbers published by the Government last year. The result is much uncertainty for plan-makers and developers alike, as they try to deal with the transitional period and then settle into the new planning system.
Stantec, working with leading experts, has created a modelling tool that explores the new housing numbers, their implications, and alternative scenarios. The tool provides integrated forecasts/projections of population, housing and jobs, combining in-house demographic modelling with the Experian local economic forecasting model. It creates scenarios to estimate the impact of aspirational economic growth on housing need, remove errors in the official projections, predict the population that would result from given levels of housing delivery and explore the implications of future changes in the official projections and the Government’s standard need formula.
As an example of the tool’s capabilities, click here to download estimates of the forthcoming household projections and resulting housing numbers. We show alternative versions of the new standard housing need figures, depending on whether the Government decides to stick to its pledge of 266,000 new homes per year.
The data tool is only part of the wider package of advice and support that we offer developers, local planning authorities and service providers. Since the NPPF replaced Regional Spatial Strategies with localism, we have been market leaders in assessing local housing needs.
The core team